Explore each indicator
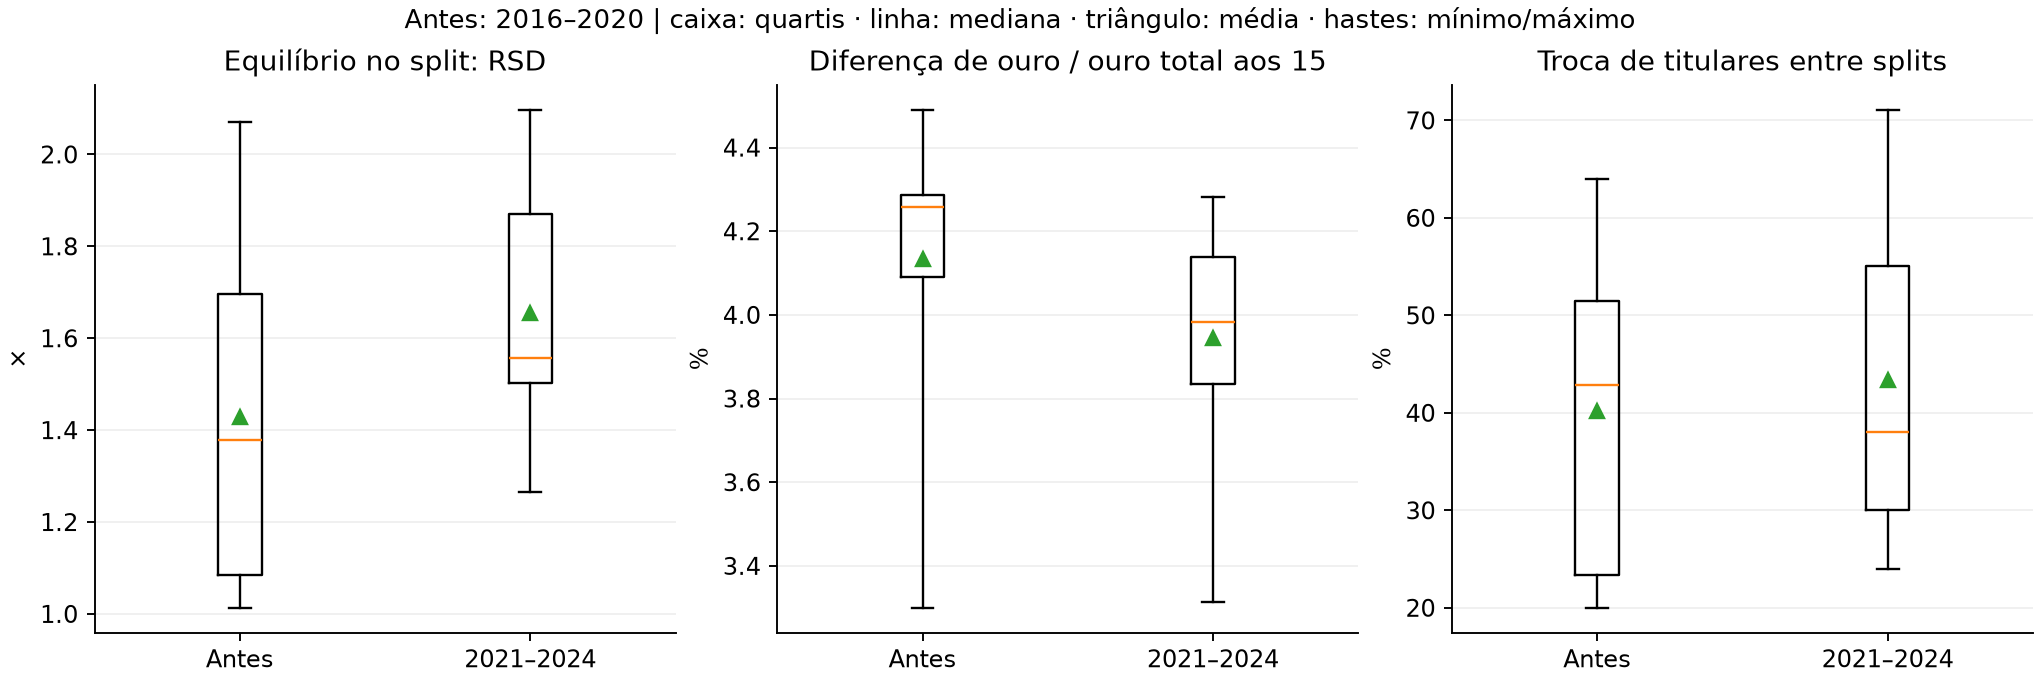
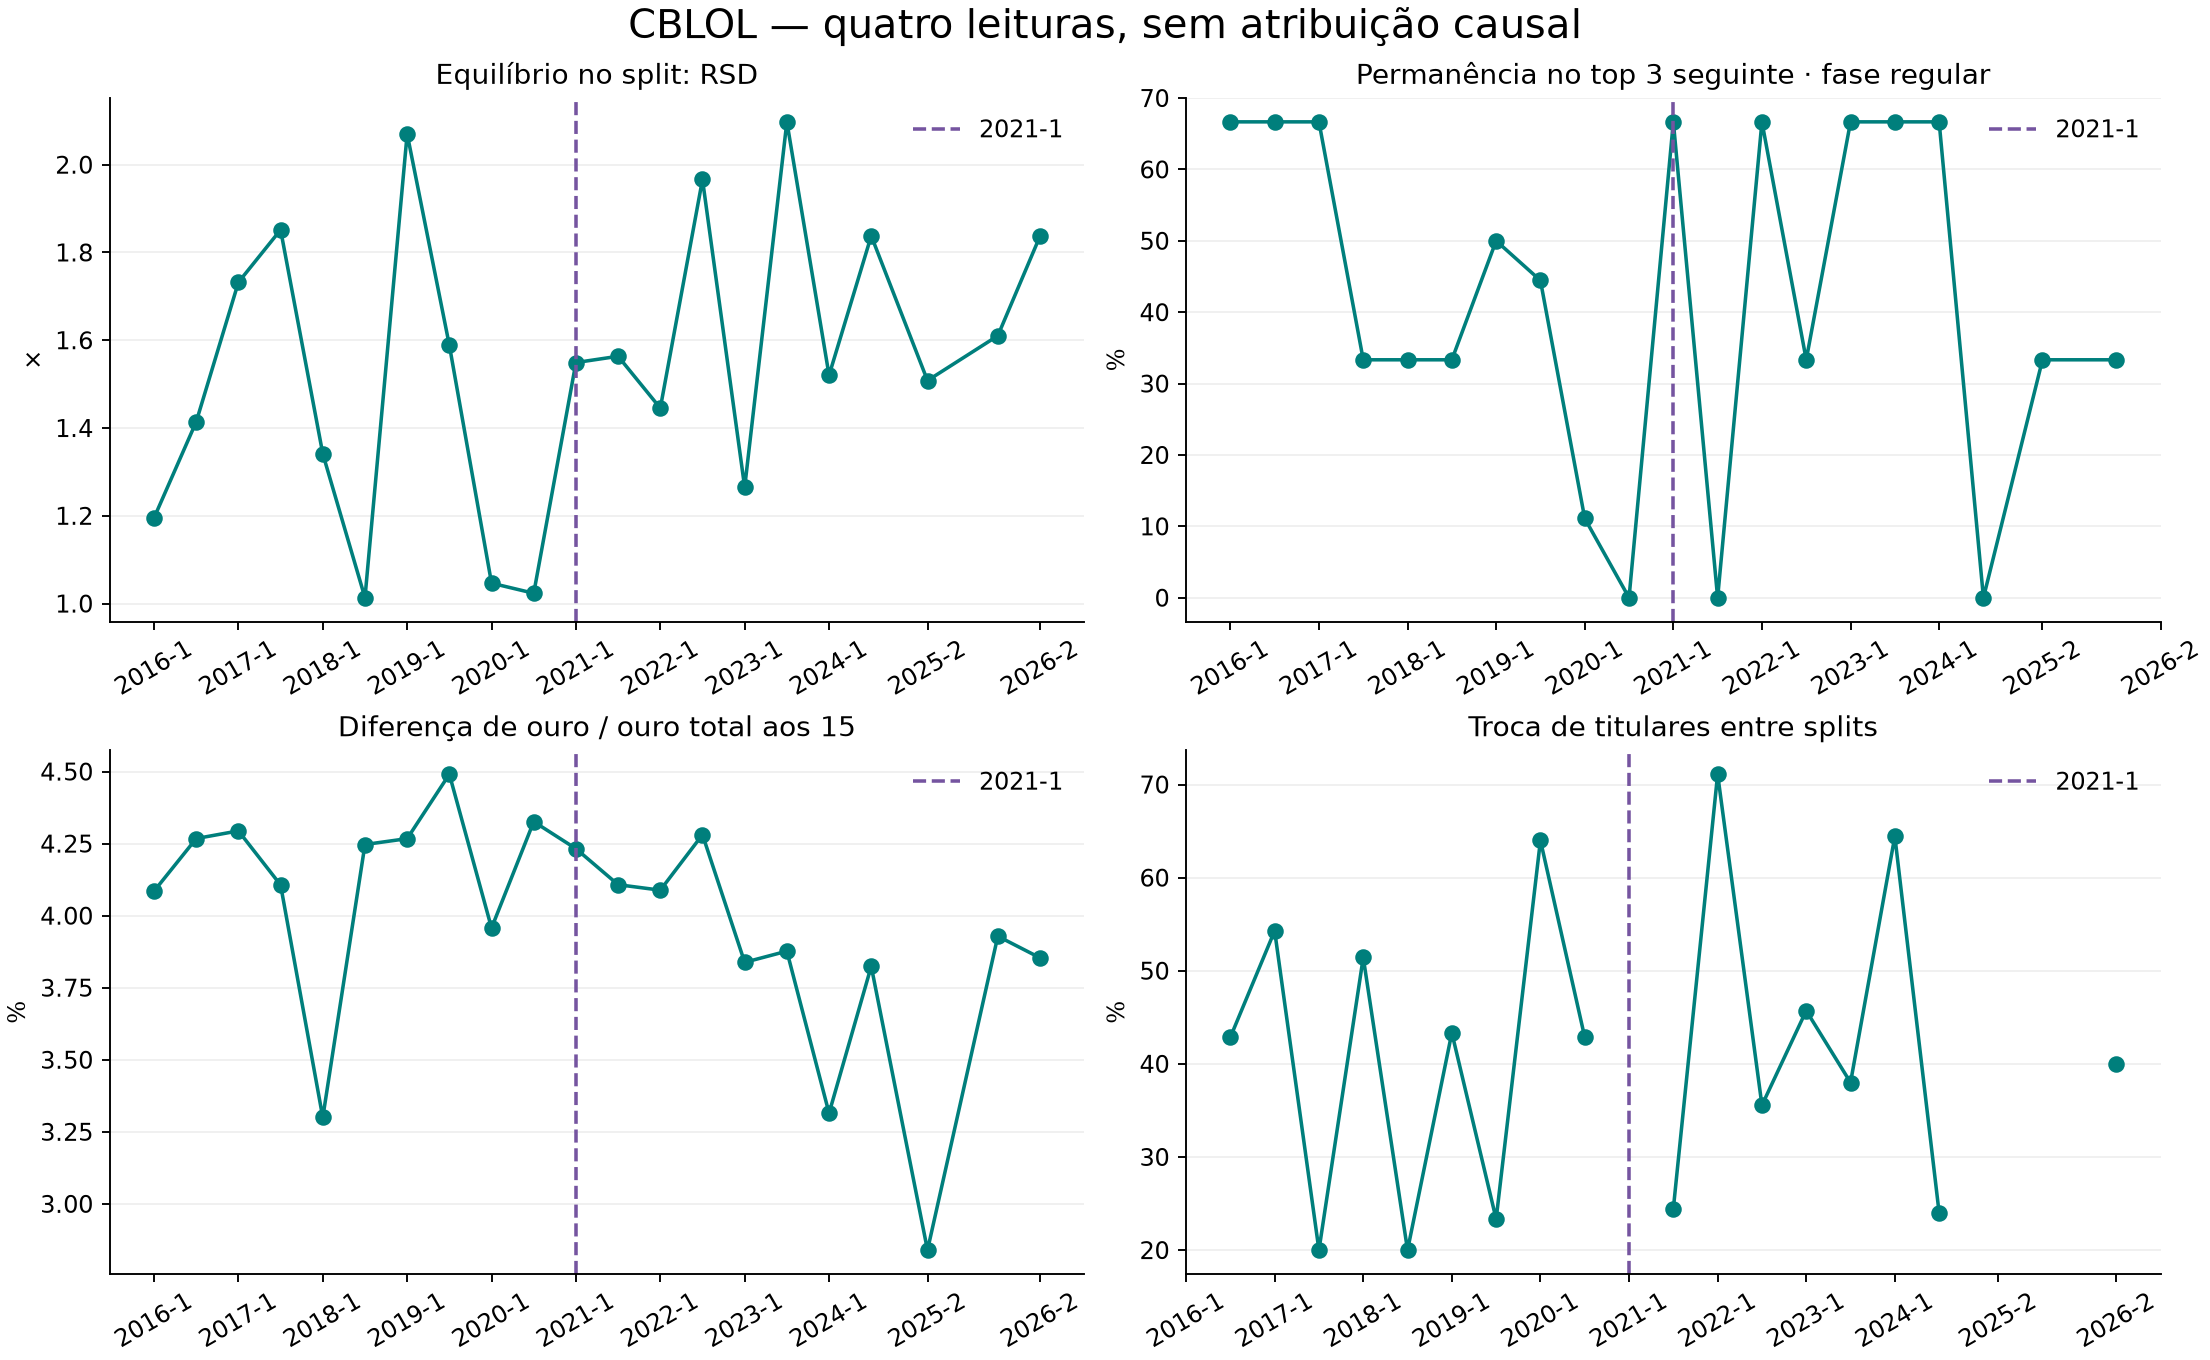
Compares observed dispersion with what an even league would produce. RSD near 1 is expected; above 1 means more separation between teams.
Uncertainty: the interval does not establish a clear direction for the difference between eras.
Expanded scale: 0.9–2.2. The axis adjusts to reveal small differences.
Box = central half of splits. Line = median.
Values, tests and statistical model
Mann–Whitney is exploratory: it also requires independence. Descriptive CI: 3,000 resamples of whole years. Few years limit precision. p = 0.1976 · q (BH) = 0.4671.
Interrupted series with time zero at 2021-1, trend, BO1 and Split 2 indicators; the extension adds indicators for 2025 LTA South and the 2026 format. HAC errors (1 lag). The 8→10 expansion coincides with franchising: their effects cannot be separated in the main window. Patches and champions are not fully controlled.
| Split | Within-split balance: RSD | Teams | Games |
|---|---|---|---|
| 2016-1 | 1.2 | 8 | 56 |
| 2016-2 | 1.41 | 8 | 56 |
| 2017-1 | 1.73 | 8 | 56 |
| 2017-2 | 1.85 | 8 | 56 |
| 2018-1 | 1.34 | 8 | 66 |
| 2018-2 | 1.01 | 8 | 70 |
| 2019-1 | 2.07 | 8 | 84 |
| 2019-2 | 1.59 | 8 | 84 |
| 2020-1 | 1.05 | 8 | 84 |
| 2020-2 | 1.02 | 8 | 84 |
| 2021-1 | 1.55 | 10 | 90 |
| 2021-2 | 1.56 | 10 | 90 |
| 2022-1 | 1.45 | 10 | 90 |
| 2022-2 | 1.97 | 10 | 90 |
| 2023-1 | 1.26 | 10 | 90 |
| 2023-2 | 2.1 | 10 | 90 |
| 2024-1 | 1.52 | 10 | 90 |
| 2024-2 | 1.84 | 10 | 90 |